

Admissions Test Scores
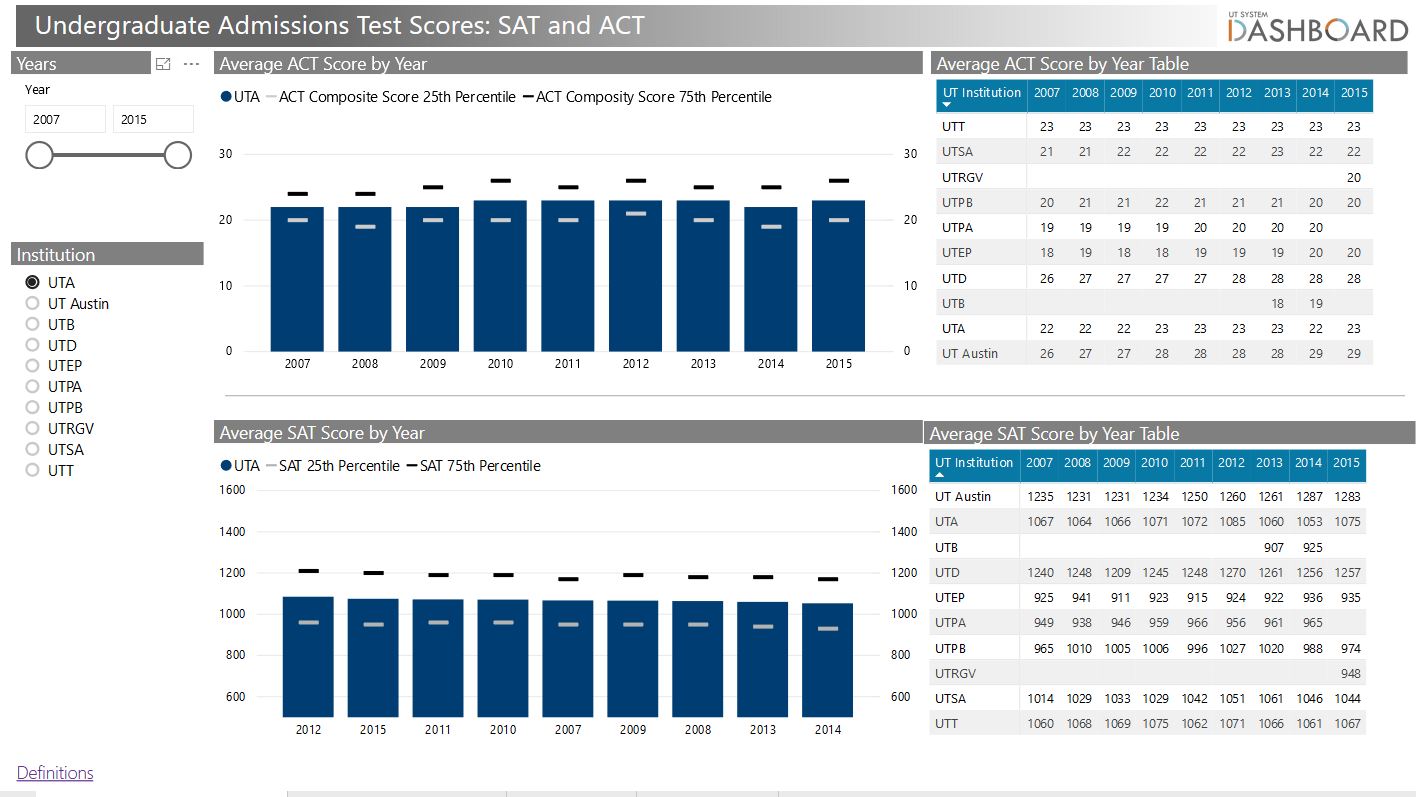
This is a two-page report. Most recent data available: Fall 2022
This report shows undergraduate and graduate admission scores. The admissions report shows average SAT scores, as well as average, 25th percentile, and 75th percentile for ACT, GMAT, GRE, and LSAT scores.
Applied, Admitted, and Enrolled
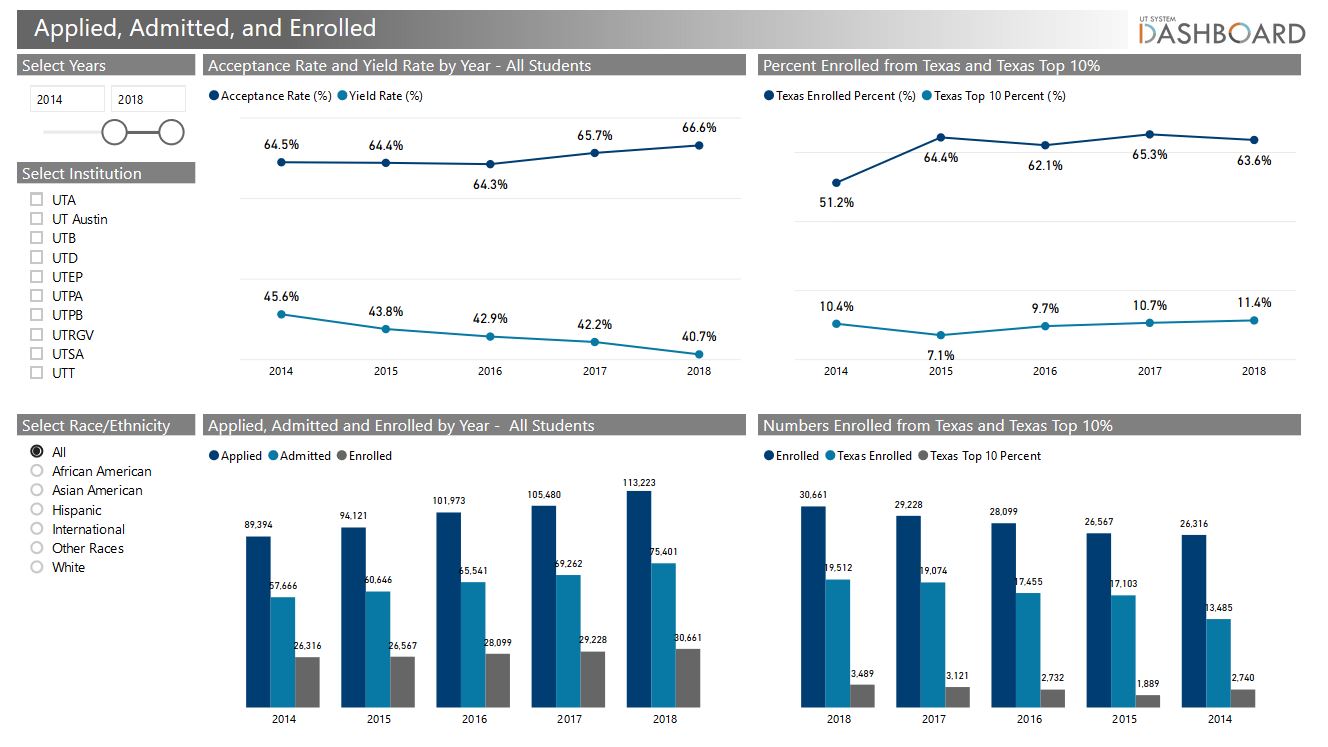
This is a one-page report. Most recent data available: Annual 2025
This report shows four visuals on first-time-in-college students who applied, were admitted, and enrolled at a UT System institution. The report also includes rates for the percent of first-year enrolled students who were from Texas and the percent of first-year enrolled students who were in the Top 10% of their class at a Texas high school.
Fall Enrollment
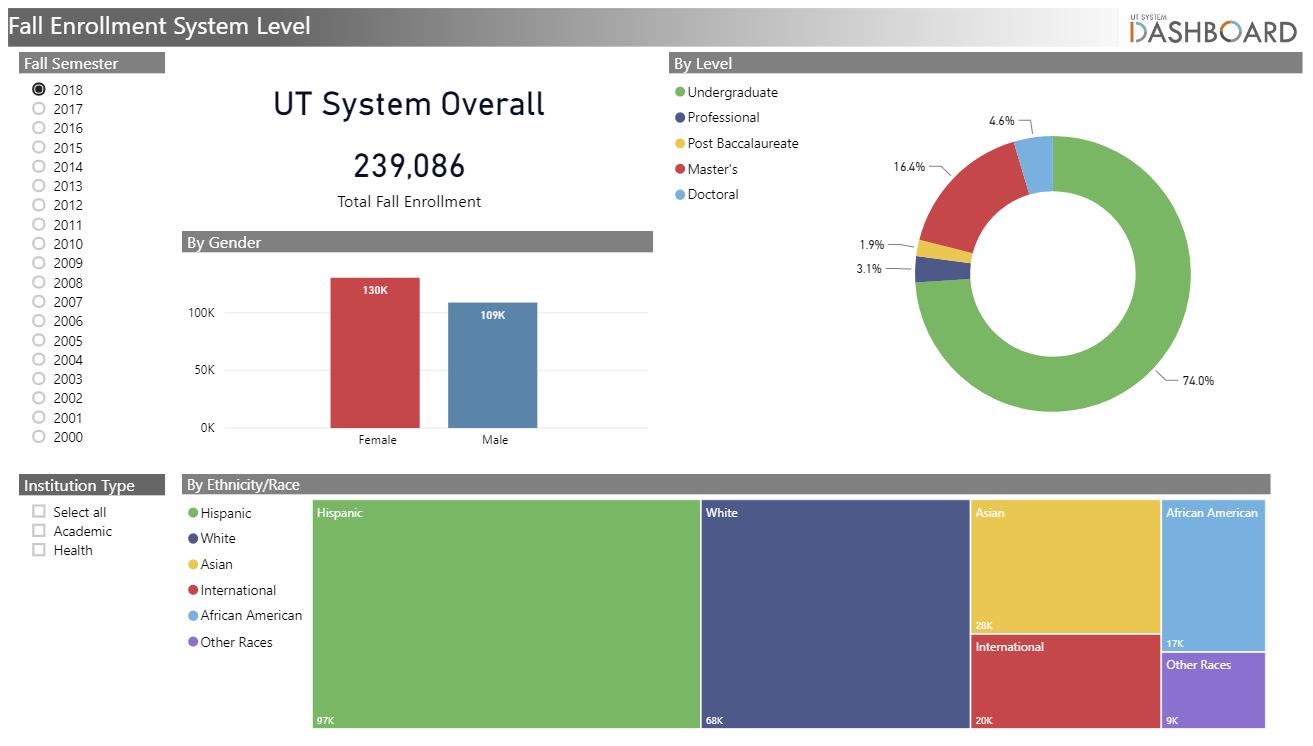
This is a two-page report. Most recent data available: Fall 2025
This report shows the overall UT System fall enrollment by gender, race/ethnicity, and level. An additional page shows multiyear fall enrollment for a selected UT System institution by race/ethnicity, status, level, and total enrollment.
Enrollment by Status
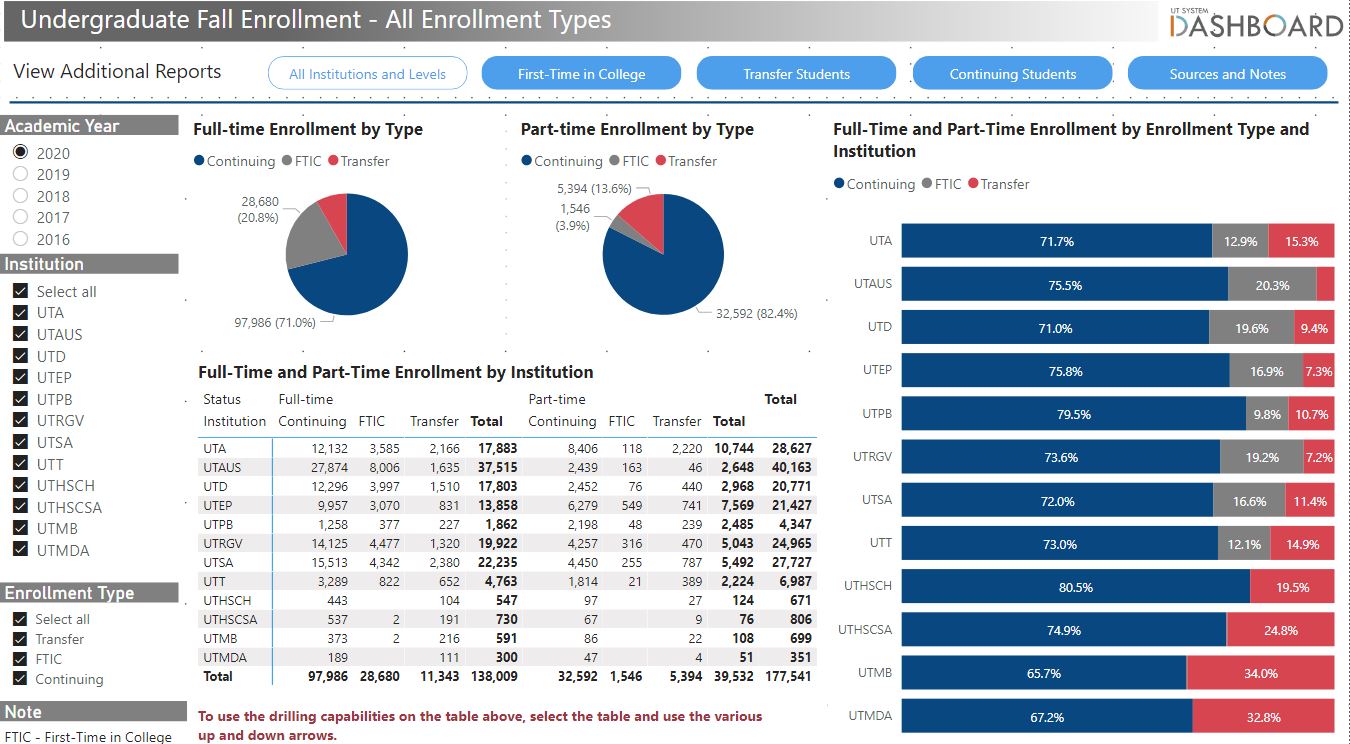
This is a four-page report. Most recent data available: Fall 2025
This report shows UT System institutions' fall full-time and part-time enrollment by first-time in college, transfers, and continuing students. Additional reports display full-time and part-time status, gender, and race/ethnicity by each of the enrollment status categories. The visualizations display information only on degree-seeking undergraduate students.
Fall Tuition and Fees
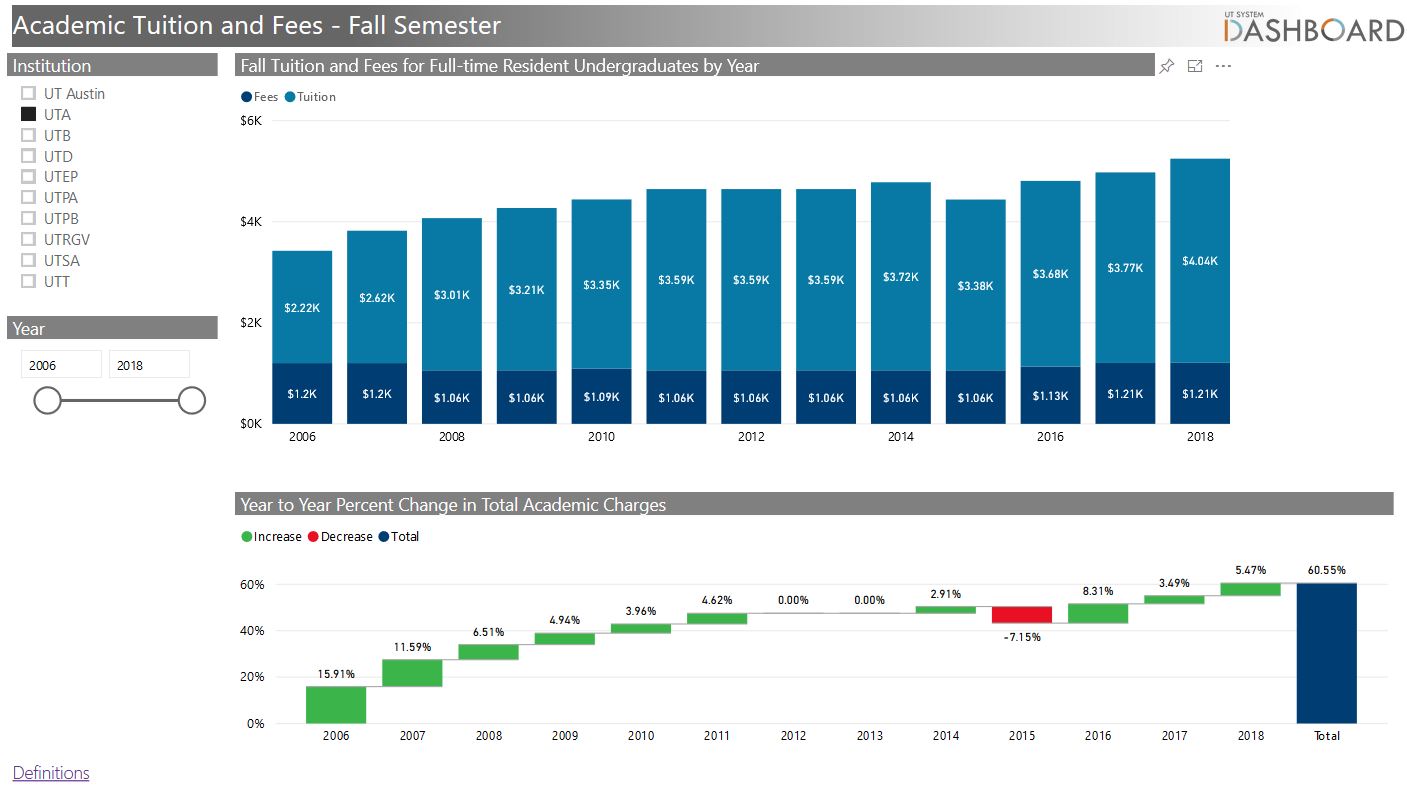
This is a one-page report. Most recent data available: Fall 2025
This report contains fall tuition and fees for undergraduates by year and the yearly percent change in total academic charges.